How to debug your Linux BSP
In the previous instalment of How to Survive Embedded Linux – How to Debug your Linux BSP – we worked through some issues you might face trying to get your Linux BSP to boot for the first time. This touched on some kernel debugging.
Here, in How to Debug Your Linux BSP, we’re going to take those skills a little further.
Debugging by printk
By far the simplest and most commonly used debug method is the humble print statement. The Linux kernel offers this in the form of printk. The format style of printk is equivalent to its standard C cousin printf, and the main difference is the addition of log levels.
For example:
printk(KERN_ALERT “reached line %d in function %sn”, __LINE__, __func__);
This line tell you what line and what function has been reached. You can litter these statements in the vicinity of where you think a crash is occurring, and start to claw back more information.
Note the use of KERN_ALERT as the log level, when adding in spurious printk’s that will be removed later, I tend to use this log level as in most cases the print will make it to every console a user is logged into (see the kernel variable of console_loglevel).
Obviously, debugging by printk has its limitations, you need to recompile and reboot every time you want to debug a new section of code.
Another issue is that prints are relatively resource-intensive, and their very presence can cause errors to magically disappear, especially if they are related to timing/resource-contention.
One last thing: make sure to remove any printk statements after your debug has finished.
How to analyse a crashdump
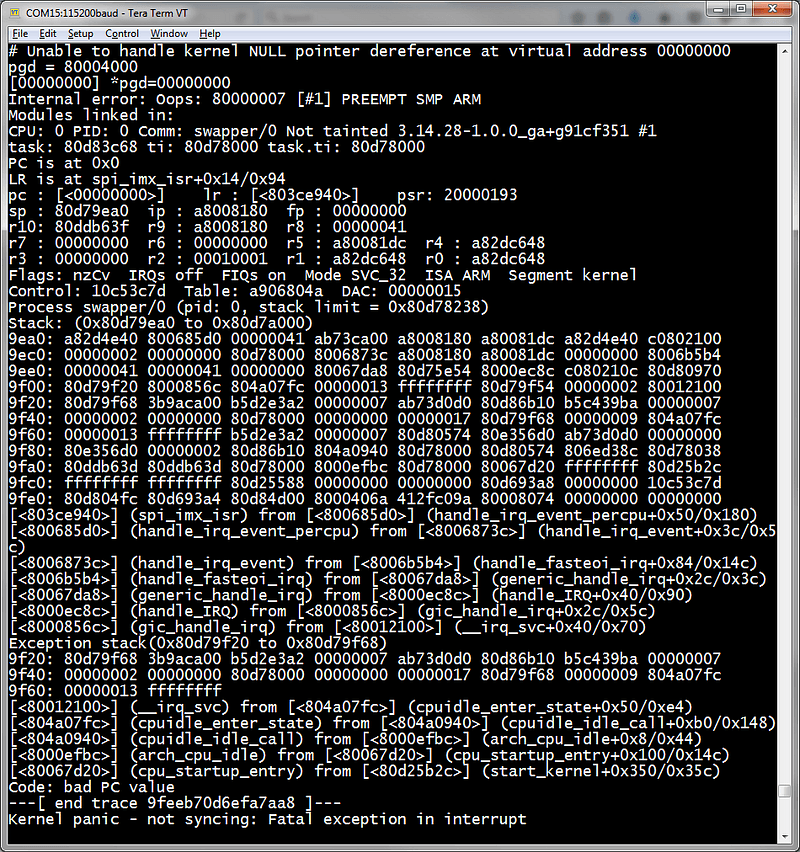
When the Linux kernel crashes, also known as a ‘Kernel Panic’, you will get a printout similar to what’s below:

If you haven’t seen many of these before, or even if you have, this can be very confusing to look at.
Basically, what is being shown here are some prints from the crash itself describing the problem somehow (if you’re lucky). In this case, it says “Unable to handle kernel NULL pointer dereference at virtual address 00000000”.
There are many lines that give you register and stack contents. You generally won’t need to use these in 99% of cases.
What will be most interesting is the list of function calls near the bottom. From the one in which the crash occurred to the top, to the earliest function call at the bottom.
Depending on whether or not you have debug symbols enabled in the kernel (CONFIG_DEBUG_INFO), the stacktrace that is shown here will either be a nice list of functions or an opaque list of memory addresses.
If you haven’t got debug symbols enabled, you can still consult your mapfile to match function names to addresses (System.map in top level of Linux build directory).
How to follow the thread of execution
Often you’ll find something isn’t going quite right after you make a certain read/write/ioctl into a certain driver, and, after a bit of reading around, you’ll be able to find where userspace and the driver meet.
From here, you might want to follow the chain of function calls down and keep track of what is going on.
Following the thread of execution generally takes a few steps. I tend to use debug prints to find out which functions are being called, which branches are being taken, this generally takes time and a lot of prints but you will make forward progress.
Sometimes, you’ll run into a function pointer, where it isn’t clear what function is behind the reference.
When this happens, you can ask your print to dump out the content of the pointer, you can then match this with your System.map file.
Admittedly, this is a very roundabout way to find out how code is being executed compared to a traditional debugger; however, this is often the easiest way when dealing with the Linux Kernel.
Another possible way to do things is by using KGDB.
Using KGDB
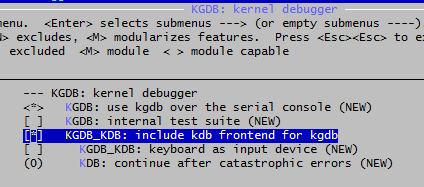
KGDB is a kernel debugger for Linux. To make use of it, you need to first enable CONFIG_KGDB and CONFIG_KGDB_KDB in your kernel configuration.

You then need to make sure you have a serial connection between your host and target machines.
What I mean by this is, you will be running GDB from your host, which will talk the KGDB service running alongside the kernel on your target hardware, the hardware you are testing.
Next, you need to pass “kgdboc=ttyS0, 115200” and “kgdbwait” as kernel command line parameters. (This assumes that you are connected to serial port ttyS0 on your target at 115200 Baud rate. Change it to match your specific setup if necessary).

Then, during bootup, when KGDB is initialised, the ‘kgdbwait’ parameter will cause execution to pause and be passed to the kdb debugger.
From the kdb command prompt, you can perform various commands, for example you can call a backtrace with ‘bt’, or you can read registers with ‘dr’. If you’re using a multi-processor CPU, then you can change cores with ‘cpu’.
You can also connect gdb from your host computer for more advanced debugging. This enables you to step through the kernel code like a regular application (hence KGDB). This will allow you to set breakpoints, at which point you can continue
Also, you can enter into kdb/kgdb in various different ways and not just during boot up.
For example, you can run “echo g > /proc/sysrq-trigger” to access the GDB console. Just make sure that “kgdboc=ttyS0, 115200” is defined in your kernel command line parameters and “kgdbwait” isn’t.
Originally published on Medium
How can ByteSnap help you today?
From start-ups to blue chips, ByteSnap’s embedded systems developers are enabling companies to stay a step ahead by providing them with bespoke solutions. Maintain your competitive edge – contact us today and find out how we can optimise your product development!


